Live.log_sklearn_plot()
Generates a
scikit learn plot and
saves the data in {Live.dir}/plots/sklearn/{name}.json.
def log_sklearn_plot(
  kind: Literal['calibration', 'confusion_matrix', 'det', 'precision_recall', 'roc'],
  labels,
  predictions,
  name: Optional[str] = None,
  **kwargs):
Usage
from dvclive import Live

with Live() as live:
  y_true = [0, 0, 1, 1]
  y_pred = [1, 0, 1, 0]
  y_score = [0.1, 0.4, 0.35, 0.8]
  live.log_sklearn_plot("roc", y_true, y_score)
  live.log_sklearn_plot(
    "confusion_matrix", y_true, y_pred, name="cm.json")
Description
The method will compute and dump the kind plot (see
supported plots) to {Live.dir}/plots/sklearn/{name} in a
format compatible with dvc plots.
It will also store the provided properties to be included in the plots section
written by Live.make_dvcyaml(). The example snippet would add the following to
dvc.yaml:
plots:
  - dvclive/plots/sklearn/roc.json:
      template: simple
      x: fpr
      y: tpr
      title: Receiver operating characteristic (ROC)
      x_label: False Positive Rate
      y_label: True Positive Rate
  - dvclive/plots/sklearn/cm.json:
      template: confusion
      x: actual
      y: predicted
      title: Confusion Matrix
      x_label: True Label
      y_label: Predicted Label
Supported plots
kind must be one of the supported plots:
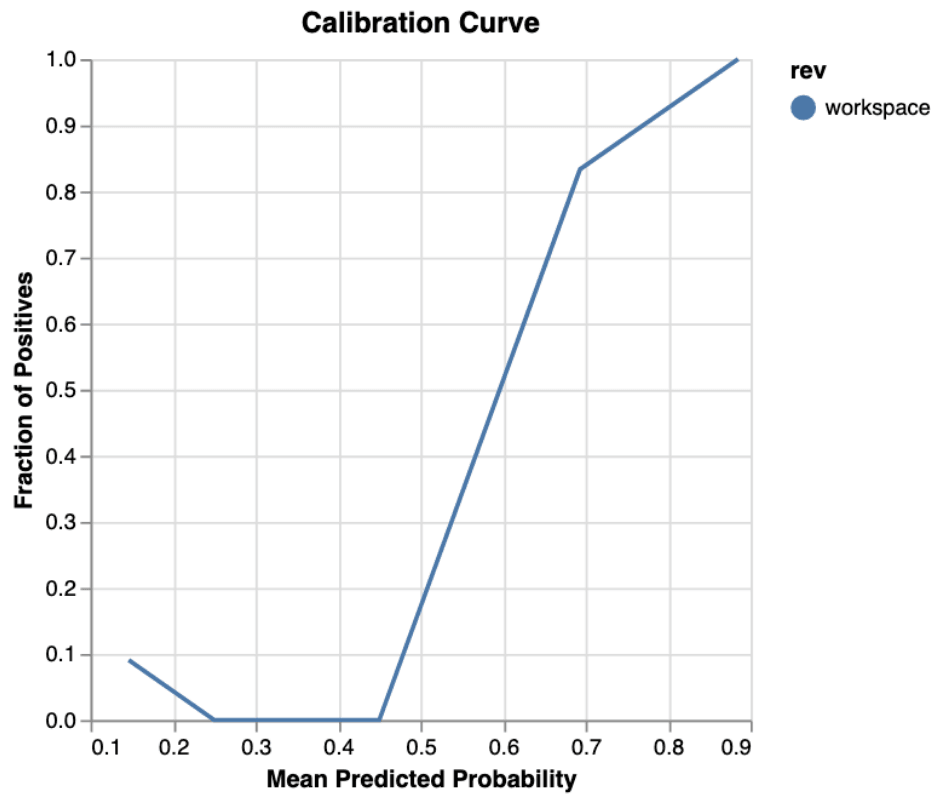
Generates a calibration curve plot.
y_true = [0, 0, 1, 1]
y_score = [0.1, 0.4, 0.35, 0.8]
live.log_sklearn_plot("calibration", y_true, y_score)
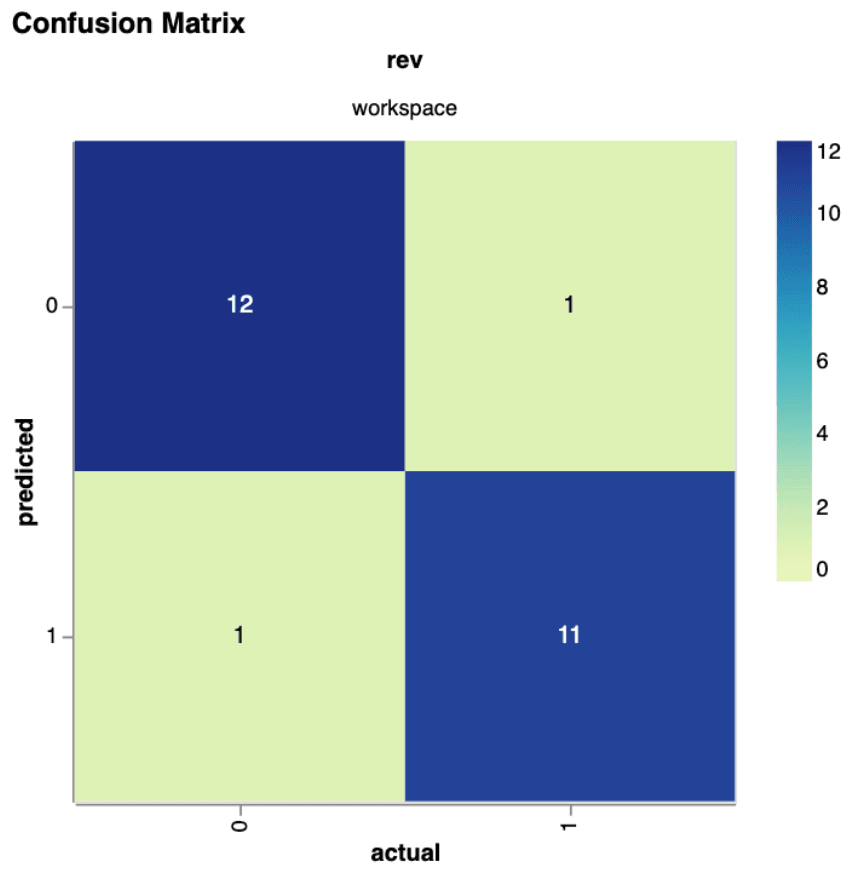
Generates a confusion matrix plot.
y_true = [1, 1, 2, 2]
y_pred = [2, 1, 1, 2]
live.log_sklearn_plot("confusion_matrix", y_true, y_pred)
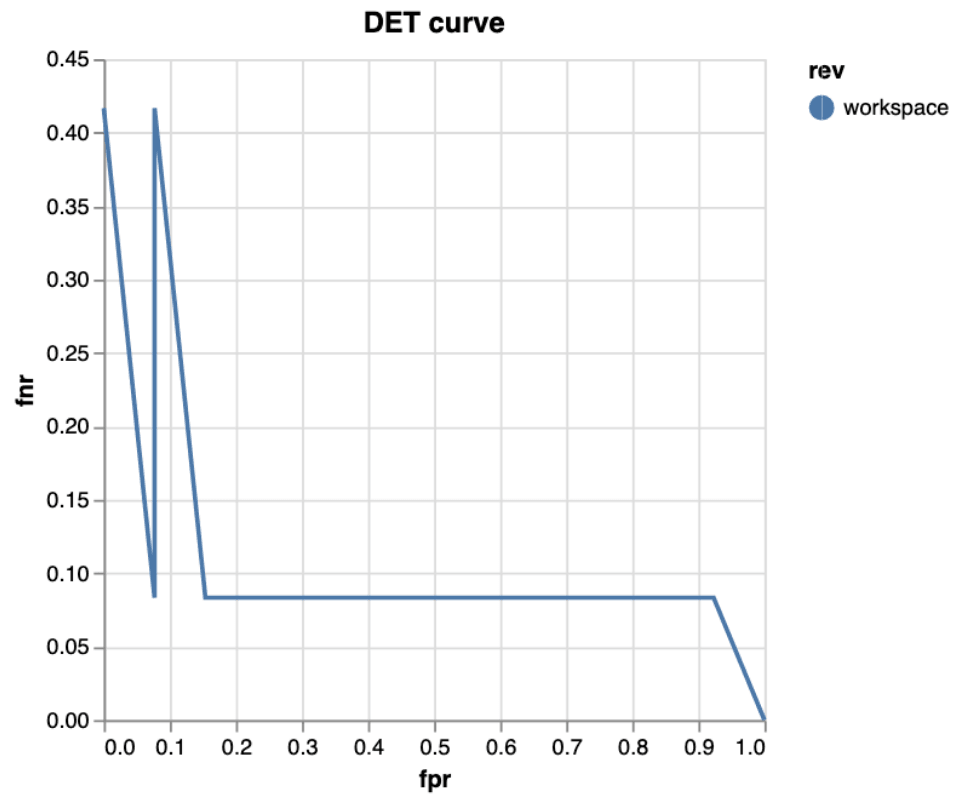
Generates a detection error tradeoff (DET) plot.
y_true = [1, 1, 2, 2]
y_score = [0.1, 0.4, 0.35, 0.8]
live.log_sklearn_plot("det", y_true, y_score)
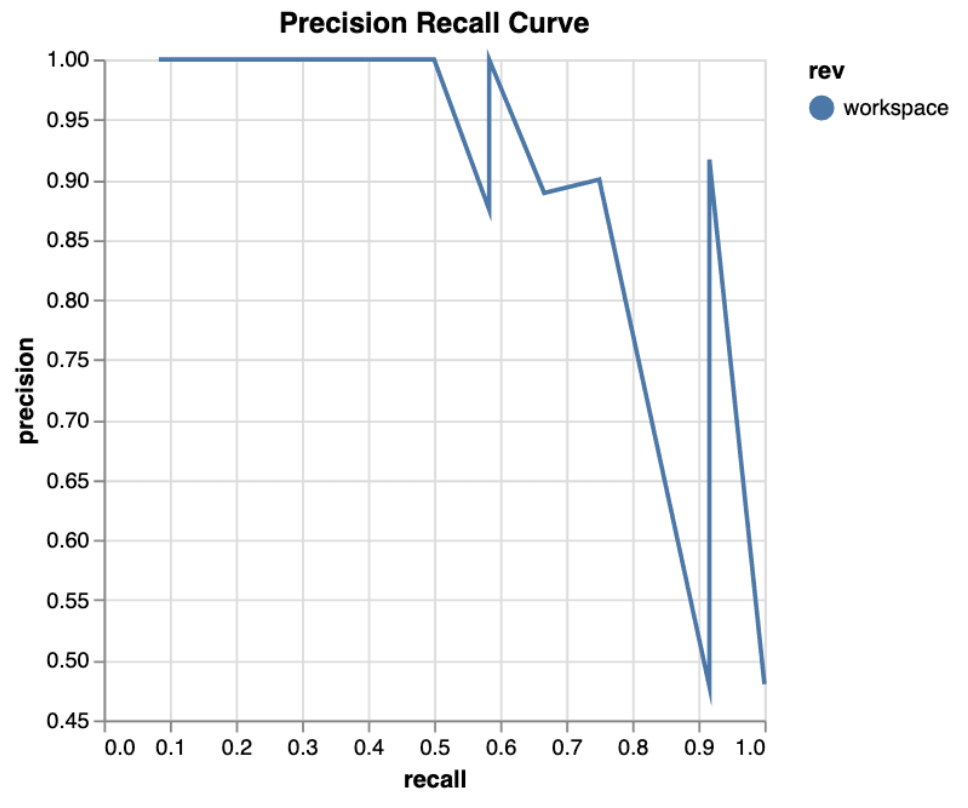
Generates a precision-recall curve plot.
y_true = [1, 1, 2, 2]
y_score = [0.1, 0.4, 0.35, 0.8]
live.log_sklearn_plot("precision_recall", y_true, y_score)
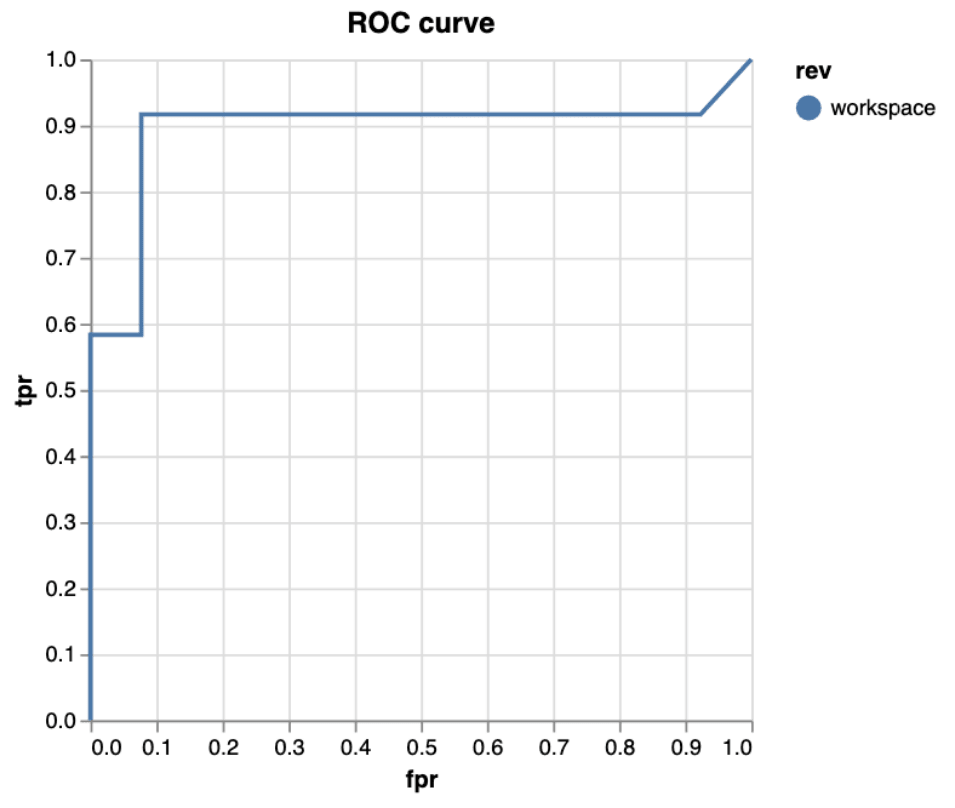
Generates a receiver operating characteristic (ROC) curve plot.
y_true = [1, 1, 2, 2]
y_score = [0.1, 0.4, 0.35, 0.8]
live.log_sklearn_plot("roc", y_true, y_score)
Parameters
-
kind- a supported plot type. -
labels- array of ground truth labels. -
predictions- array of predicted labels (forconfusion_matrix) or predicted probabilities (for other plots). -
name- optional name of the output file. If not provided,kindwill be used as name. -
**kwargs- additional arguments to tune the result. Arguments are passed to the scikit-learn function (e.g.drop_intermediate=Truefor theroctype). Plus extra arguments supported by the type of a plot are:normalized- default:False.confusion_matrixwith values normalized to<0, 1>range.
Exceptions
dvclive.error.InvalidPlotTypeError- thrown if the providedkinddoes not correspond to any of the supported plots.